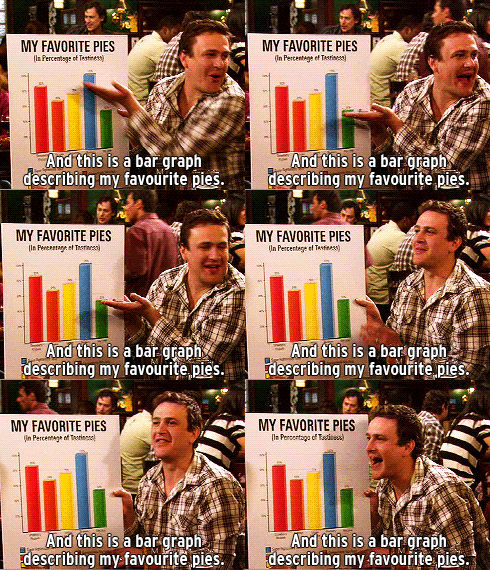
True story: The idea for TVShowGraphs.com was partially influenced by the graph & chart-loving character Marshall from How I Met Your Mother. Marshall’s ability to turn literally any subject into a graph got me to thinking that it would be fun to do that same thing… but with all topics related to television!
This was the very first chart / graph I created under the @tvshowgraphs name - I’ve always loved these sorts of playful flow charts from magazines and so I figured it would be a fun place to start… and I always love a good excuse to recommend shows to others!
I’ve had a blast doing genre and decade takeover weeks over on my @tvshowgraphs Twitter & Instagram pages - this graph was from 90s Takeover Week (my personal favorite decade!).
TVShowGraphs.com is a celebration of the brilliance, the history, & the joy of television…
This site was inspired by my love for television - and my persisting conviction that television truly is a legitimate form of art. The graphs (and charts, and lists…) on here span all decades and genres of television, and aim to create ongoing community and discussion around the medium of television.
TV Show Graphs started out as a Twitter page and Instagram page (and these channels are still going strong - find us at @tvshowgraphs!), as a way for me to share graphs, charts, & lists that I’ve created and to connect with others who are equally passionate about television. I have decided to expand TV Show Graphs from social media to this blog, because I’ve found that many of the graphs are best shared alongside a story, some bits of trivia, additional analysis, or even just a little more context about what I think makes each one worth discussing. My own background spans multiple genres (back in college, I was a mathematics & psychology major, with a minor in visual arts) - TVShowGraphs is a way for me to combine my love for data/graphs, human behavior, pop culture, trivia, & visual design.
Some of the graphs you’ll find on here are totally subjective and opinion-based… things that are meant for fun and to spark conversation (e.g. which 90s Nickelodeon game shows were most awesome vs. just ‘sorta’ awesome?). Other graphs aim to really dive into data and metrics surrounding television, to uncover interesting trends (I am a data nerd at heart!). You’ll also see some just-for-fun meme-style graphs on here, plus some graphs developed from user polls that I’ll run from time to time. I like to have fun with the visual & design element for some graphs (bringing in imagery from the show(s) being featured), while in other cases, I let the data speak for itself. Anything is fair game!
I hope you find something in here that interests you, or maybe that makes you think about a beloved television show in a different way. One of my favorite parts of running TV Show Graphs is forming connections with other television enthusiasts, pop culture critics, and fans - so please drop me a note if you want to connect, if you have any suggestions for graphs, charts, or lists you’d like to see, or if you’re interested in doing a collaboration. I welcome your comments, suggestions, and TV opinions on any of the blog posts you find here as well.
See you out there in TV Land!
-Jamie
Just A Few of My All-Time Favorite TV Shows:
Laverne & Shirley
Breaking Bad
The Comeback
Crazy Ex-Girlfriend
Friends
Better Call Saul
Fleabag
Friday Night Lights
The Brady Bunch
One Day at a Time
About Jamie
Hi there, I’m Jamie. I’m the creator of TV Show Graphs - thanks for stopping by! I currently reside in the Boston, MA area (I have lived here for the past 13 years!) - but my home state of Maine also holds a special place in my heart. I attended college at Bowdoin College, where I studied math, psychology, and visual arts. TV Show Graphs is a passion project of mine, but I also have a day job working in global operations management for a technology company. In my spare time (when I’m not working, watching television, or making graphs), I enjoy experimenting with new recipes, checking out all the pub trivia spots across Boston, trying any sort of crafty project that lands my way (scrapbooking & watercolors are my latest addictions), and attempting to visit as many mini golf courses as possible with my husband.
My love for television can be traced back to my early years watching as many Full House reruns as I could (until I was banned by my parents from watching the show because I was taking on too much “Michelle Tanner attitude” - true story). My soft spot for classic TV in particular can be traced back to my preteen years, when I became beyond obsessed with Nick at Nite (I would tape episodes of Laverne & Shirley, Happy Days, & The Brady Bunch onto every VHS tape I could find). As an adult, I have enjoyed discovering as many new shows as I can, soaking up television trivia, and reading the work of legendary TV analysts & critics like Emily Nussbaum. Oh, and I always love a good TV show recommendation - if you have any, I’m all ears!


